February 17, 2023
Data-Driven Decisions: Building Meaningful Metrics for Product Success
Go deeper than conversions. Measure what matters, make choices that stick, and build a product with purpose.
Product metrics are essential for successful product management. By tracking the right metrics, you can gain valuable insights into how your product is performing, what your users are doing, and where you need to improve.
But with so many different product metrics to choose from, it can be difficult to know which ones to focus on. That's why we've put together this comprehensive guide to product metrics. We'll cover everything from the basics of product metrics to how to use them to improve your product.
What are Product Metrics?
Product metrics are quantitative measures of how your product is performing. They can track a wide range of things, such as aquisition performance, user engagement, features adoption, or monetization, among others. Product metrics are essential for product managers because can help to:
- Understand how their product is being used
- Identify areas where the product can be improved
- Measure the impact of product changes
- Make informed decisions about product development
How to Choose the Right Product Metrics to Track
Selecting the appropriate product metrics requires a strategic alignment with your product vision and end goals. To ensure a robust measurement framework, consider incorporating OKRs (Objectives and Key Results) and adhering to SMART (Specific, Measurable, Achievable, Relevant, Time-bound) objectives principles.
Here are some guidelines to assist you in choosing the right product metrics:
- Align Metrics with Product Vision and End Goals: This alignment ensureS that improvement in these metrics directly correlates with progress toward achieving your product goals. These are the metrics that serve as reliable indicators of success.
- Utilize OKRs and SMART Objectives: Implement OKRs to set clear objectives and key results that are specific, measurable, achievable, relevant, and time-bound.
- Prioritize Actionable Metrics: They provide insights that lead to informed decisions and concrete actions. Non-actionable metrics may offer data but lack a clear path for improvement or intervention. Avoid falling into vanity metrics, such as total downloads or website visits, may seem impressive but do not necessarily contribute to the core goals. These can provide a high-level view, but they often lack actionable insights that drive meaningful changes.
- Distinguish Leading vs. Lagging Indicators: Leading indicators forecast future performance or provide instant feedback (eg: feature adoption rates or conversion rates), enabling proactive adjustments, while lagging indicators reflect past performance (eg: churn rate or CSAT). A balanced approach provides a comprehensive view of your product's trajectory.
- Track Metrics Over Time: Consistently monitor metrics over time to identify trends and patterns. This historical perspective helps in understanding the impact of changes, making it easier to adapt strategies and optimize product performance.
Useful frameworks to consider
There are a number of popular frameworks that offer structured approaches to thinking about product metrics, each with its unique focus. Familiarizing yourself with these frameworks can provide valuable insights into selecting and analyzing metrics for your product. Here are a few noteworthy frameworks:

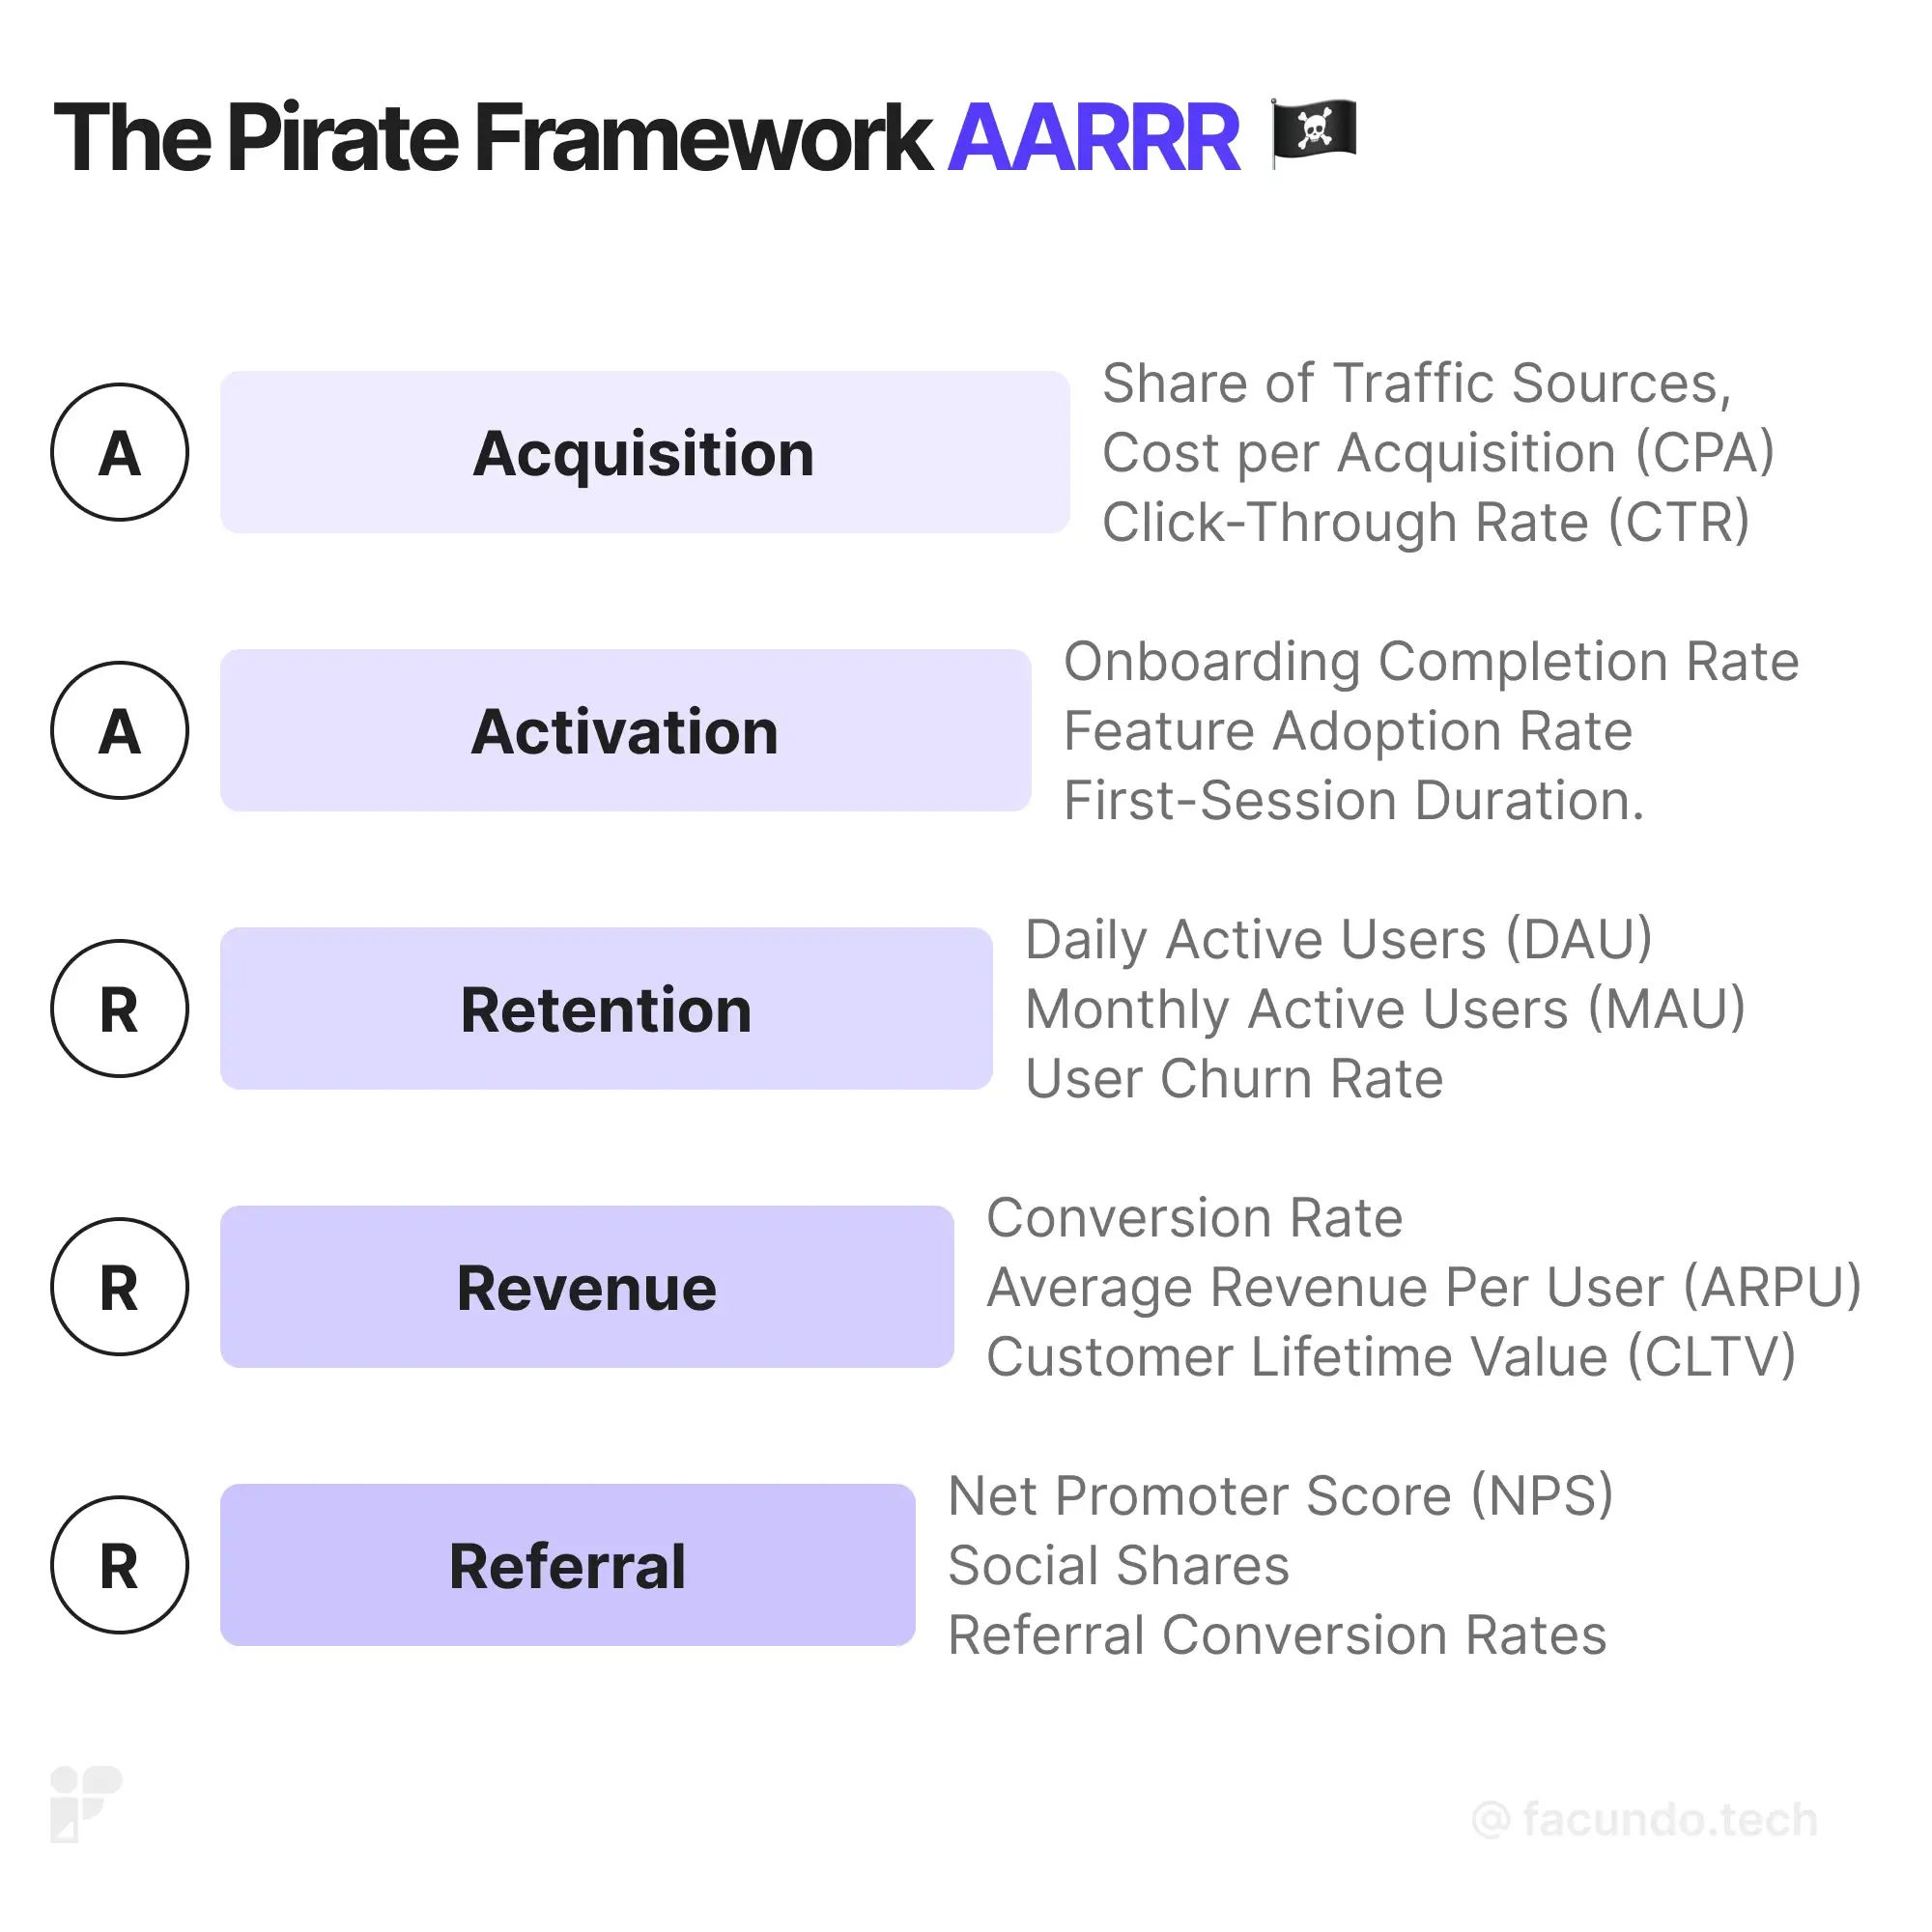
The Pirate Metrics (AARRR) framework. The AARRR framework, often referred to as the Pirate Metrics, is a comprehensive model designed to capture the key stages of a user's journey and product success. The acronym AARRR represents:
- Acquisition: In this stage, the focus is on understanding how users discover your product. This involves analyzing the channels and methods through which potential users are drawn to your offering. e.g., Share of Traffic Sources, Cost per Acquisition (CPA) or Click-Through Rate (CTR).
- Activation: Activation zeroes in on the user's initial experience with your product. It assesses whether users have a positive and engaging first encounter, laying the foundation for continued interaction. e.g., User Onboarding Completion Rate, Feature Adoption Rate or First-Session Duration.
- Retention: Retention examines whether users continue to return to your product after their initial engagement. This metric is crucial for assessing the long-term appeal and stickiness of your offering. e.g., Daily Active Users (DAU), Monthly Active Users (MAU), or User Churn Rate
- Referral: Referral gauges whether existing users actively advocate for your product by recommending it to others. This word-of-mouth promotion can significantly contribute to the growth of your user base. e.g., Net Promoter Score (NPS), Social Shares or Referral Conversion Rates
- Revenue: The final element, Revenue, delves into the monetization strategies of your product. It involves understanding how your product generates income and sustains its financial viability. e.g., Conversion Rate, Average Revenue Per User (ARPU) or Customer Lifetime Value (CLTV)
By systematically addressing each element in the AARRR framework, businesses gain valuable insights into the entire user lifecycle, enabling them to optimize strategies for user acquisition, engagement, and sustained growth.


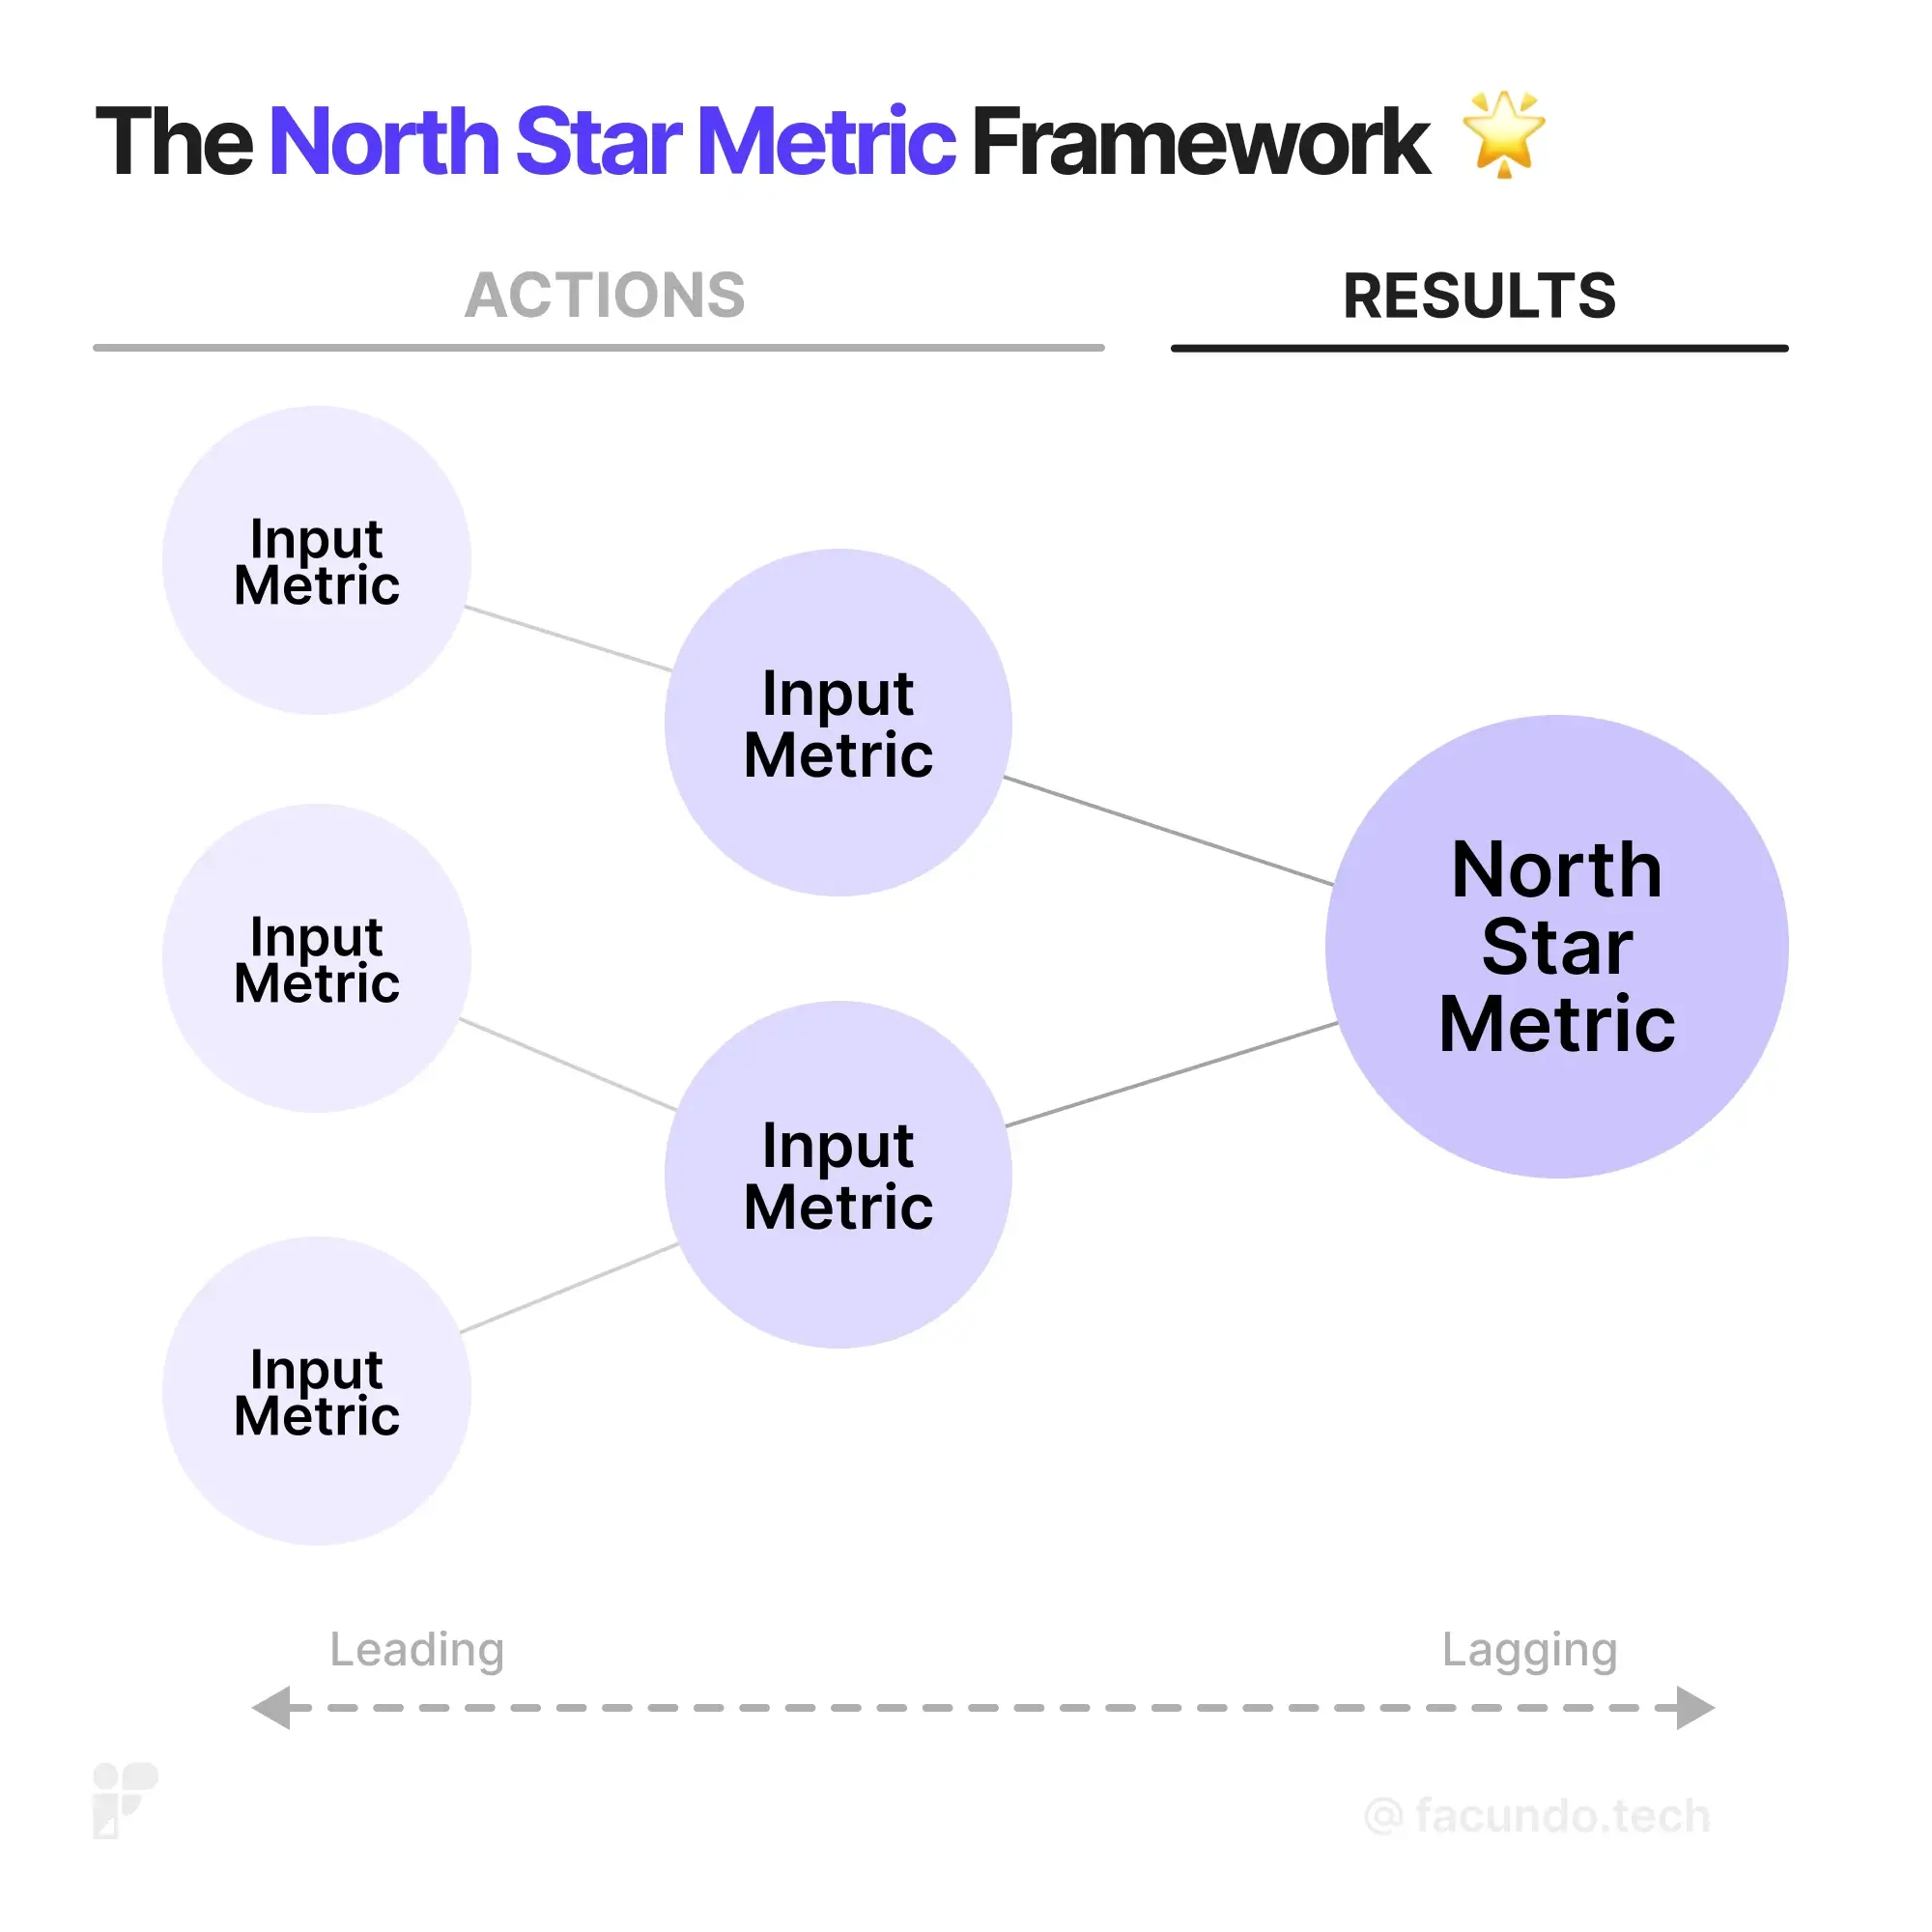
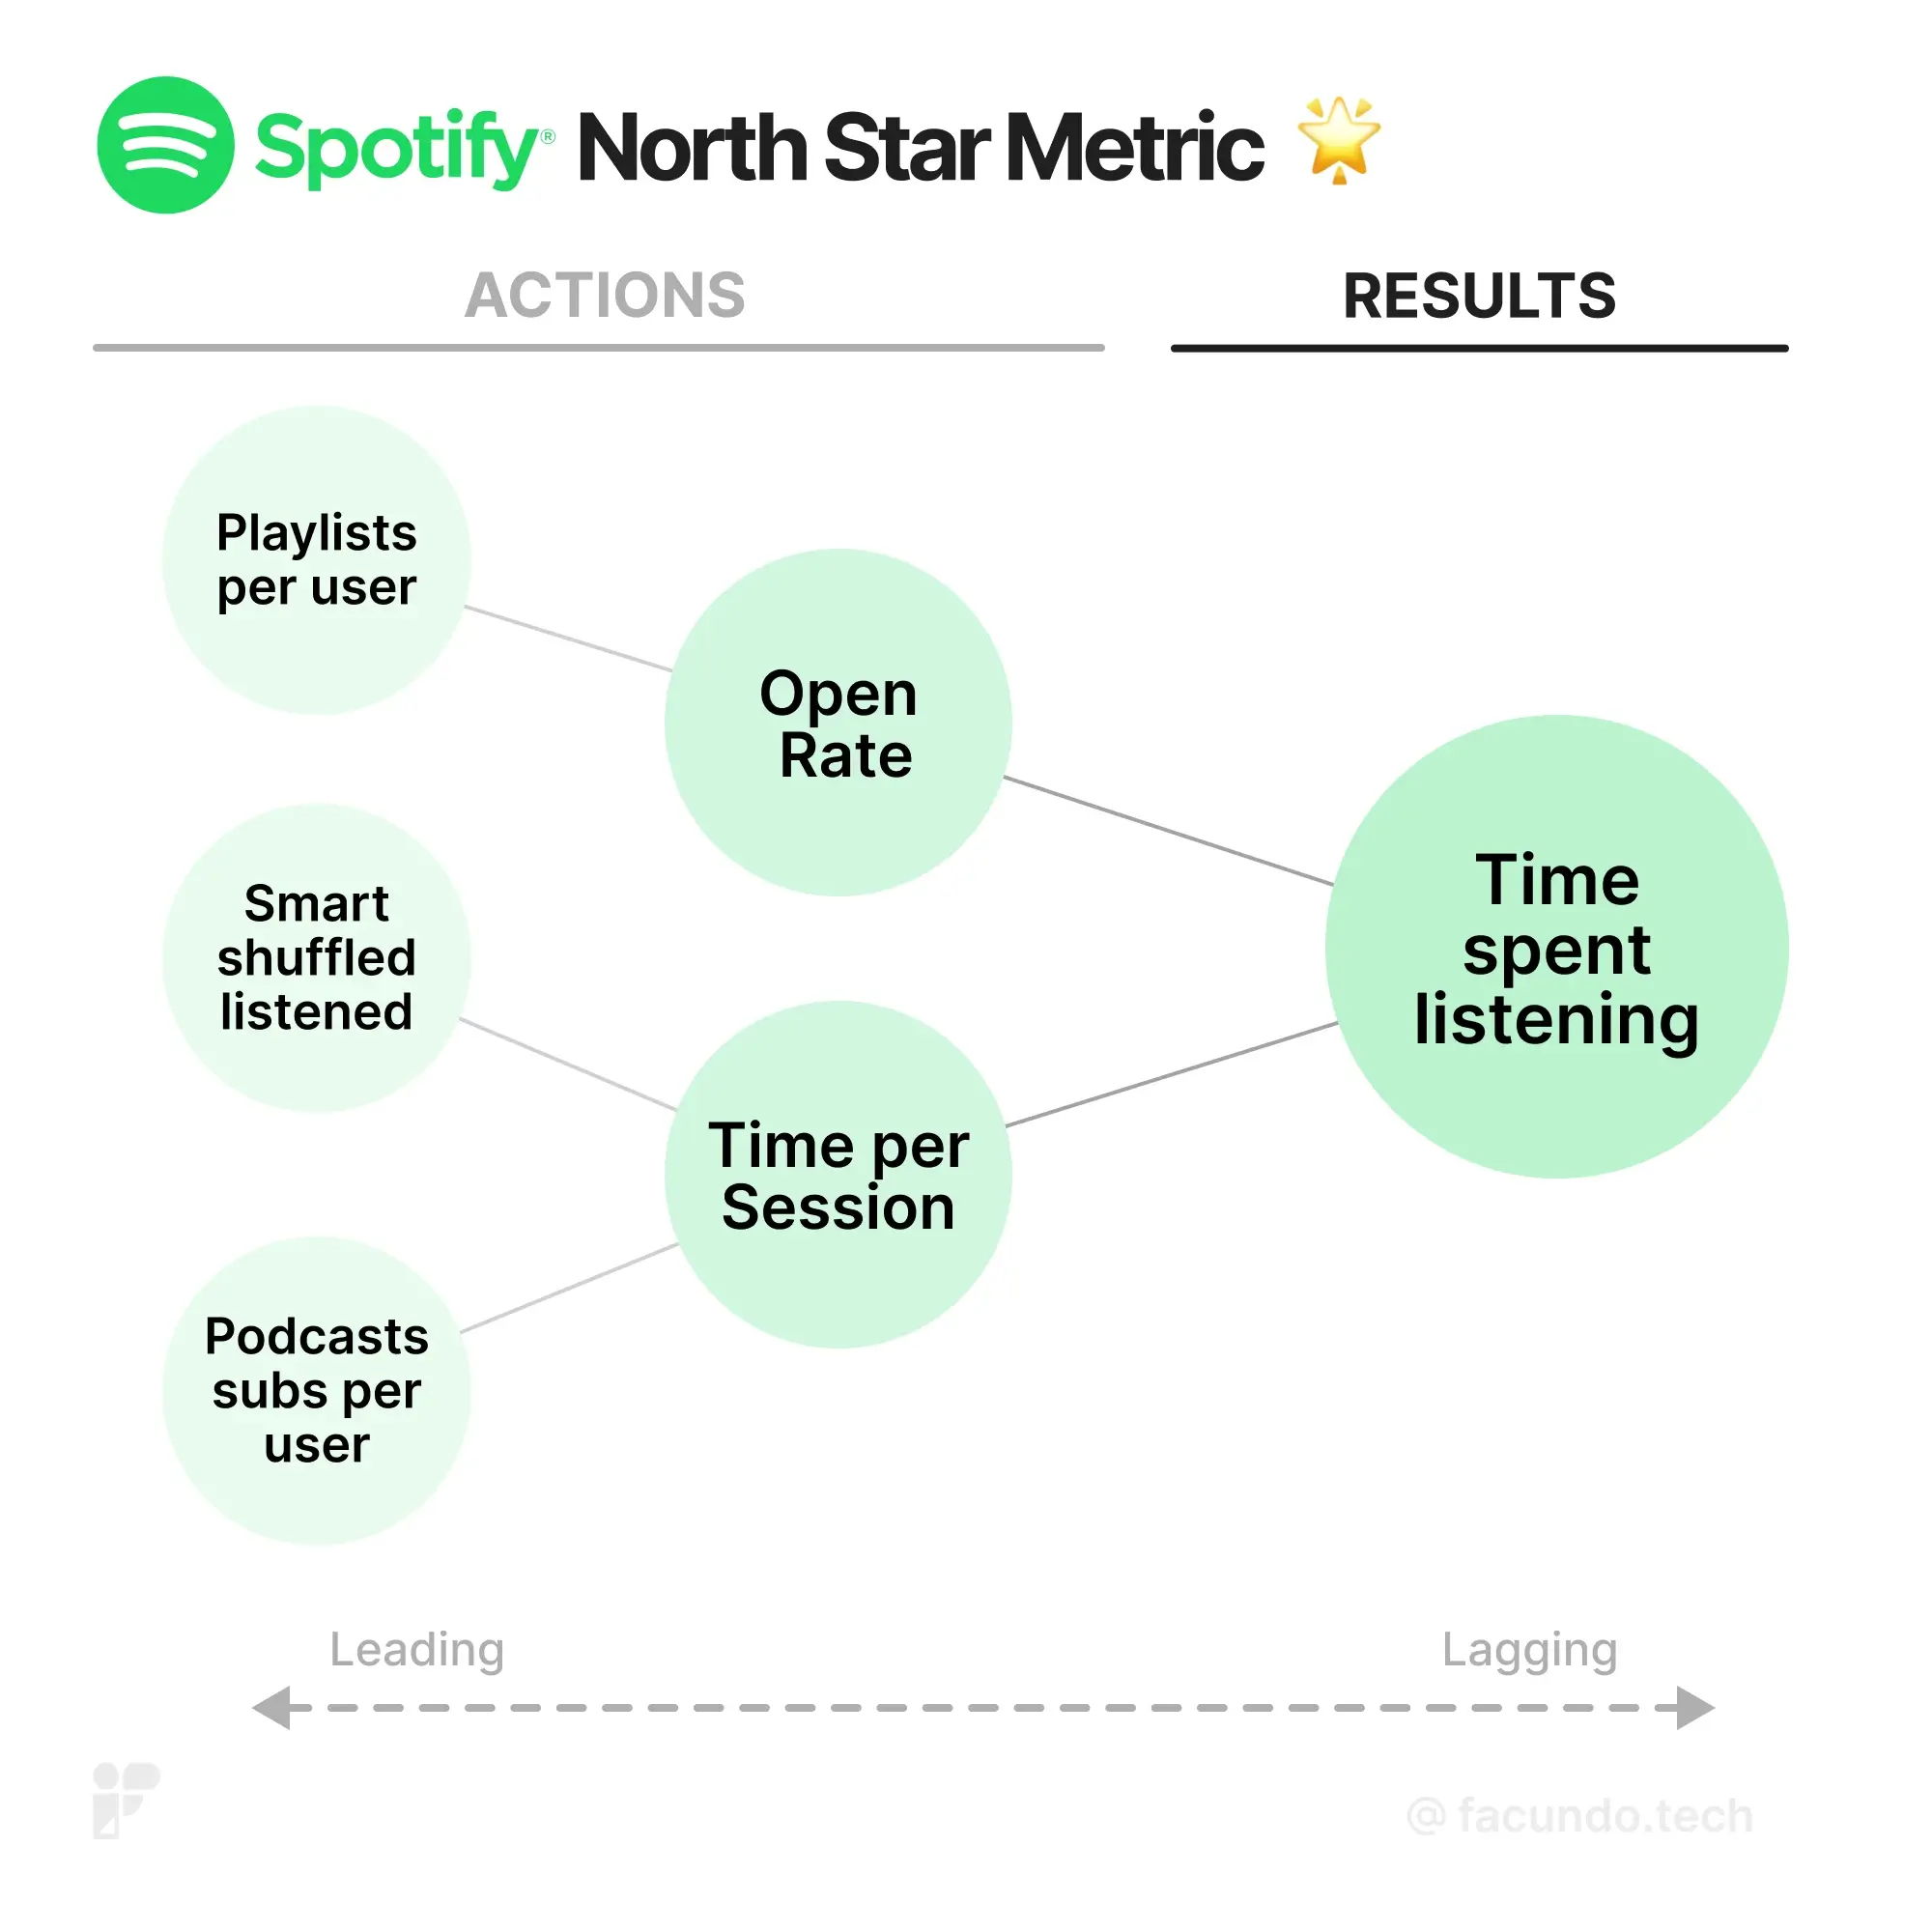
The North Star Metric framework. This method poses a single, overarching metric that encapsulates the core value your product delivers to users. It serves as a guiding light, aligning the entire team toward a common goal. A good North Star Metric possesses three key attributes:
- Measures Value Realization: It pinpoints the precise moment when a customer experiences the core value of your product.
- Aligns with Product Strategy: It's tightly interwoven with the heart of your current product strategy.
- Acts as a leading (not lagging) indicator: It reliably predicts future outcomes that are crucial to your company's growth.
Although this framework offers structured approach, consider balancing focus and nuance. The concept of a single key metric simplifies communication, but it may not always be sufficient. For most large companies navigating complex ecosystems, finding the right balance involves focusing on 1-3 core key influencers of the north star metric. Having too many can lead to confusion, while relying on just one might overlook critical trade-offs.
To choose a right North Star Metric for your product, start by recognizing the fundamental game your product plays. Is it the Attention Game? (such as Facebook or Netflix) Is it the Productivity Game? (such as Slack or Dropbox) Or is it the Transaction Game? (such as Amazon or Uber)
For example, Facebook and Netflix both play the attention game, but their NSMs differ due to their distinct business models. Facebook maximizes feed engagement to drive ad revenue and Netflix prioritizes active subscribers due to its subscription model.
Other popular frameworks include the HEART framework, the One Metric That Matters (OMTM), and the GAME Framework.
Choosing the best framework depends on your product, goals, and preferences. Exploring these frameworks can offer diverse perspectives to define a useful set of metrics.
20 Essential Product Metrics for Effective Management
Here’s a cheat sheet of of 20 critical metrics, along with clear definitions and formulas, to guide your product management journey
Acquisition & Growth
- Customer Acquisition Cost (CAC): Cost of acquiring a new customer.
- Conversion Rate: Percentage of users who complete a desired action (e.g., signup, purchase).
- Bounce Rate: Percentage of visitors leaving your site without interacting.
- Activation Rate: Percentage of users who take a key action after signup (e.g., first product use)
- Monthly Recurring Revenue (MRR): Predictable revenue generated each month from subscriptions or recurring payments. Formula: Total recurring revenue in a month.
- Annual Recurring Revenue (ARR): Aggregate MRR of a full year.
Engagement & Usage
- Monthly Active Users (MAU): Number of unique users interacting with your product in a month.
- Daily Active Users (DAU): Number of unique users interacting with your product in a day.
- Average Session Duration: Average time users spend per session
- Session Frequency: Average number of sessions per user in a period.
- Feature Adoption Rate: Percentage of users who use a specific feature.
- Error Rate: Percentage of user interactions resulting in errors.
Retention & Churn
- Retention Rate: Percentage of users who remain active over a specific period (e.g., month, quarter).
- Churn Rate: Percentage of users who stop using your product within a specific period.
- Net Promoter Score (NPS): Measures customer loyalty on a scale of -100 to +100.
- Customer Satisfaction Score (CSAT): Measures customer satisfaction with a specific interaction or experience.
Financial & Business
- Average Revenue Per User (ARPU): Average revenue generated per user in a period.
- Customer Lifetime Value (CLTV): Total revenue a customer generates over their relationship with your product.
- Payback Period: Time it takes to recoup the CAC through customer revenue.
- Market Share: Percentage of the total market captured by your product.
Conclusion
Product metrics serve as indispensable tools for product managers to gauge performance, user behavior, and areas for improvement. By aligning metrics with product vision, employing frameworks, and tracking a strategic set of metrics, teams can make informed decisions, optimize product strategies, and enhance overall product success.
Here are some key takeaways:
- Prioritize metrics that directly align with your product vision and end goals.
- Utilize frameworks like AARRR, North Star Metric, HEART, OMTM, and GAME to structure your approach to product metrics.
- Balance the focus on both output and input metrics, considering actionable insights over vanity metrics.
- Recognize the distinction between leading and lagging indicators for a comprehensive view of your product's trajectory.
- Regularly track and analyze metrics over time to identify trends and make data-driven decisions.
- Tailor your choice of framework and metrics to the unique characteristics of your product and business objectives.